Health, alerts and monitoring
Your device page tells you in one line whether everything is fine. Two alerts warn you by email when it is not. If you want numbers and thresholds, the advanced view has a Monitoring tab and an event log.
The health page
Open Device in the top bar. With one device you land on its health page. With several you get a tile per device and an Add a device card.
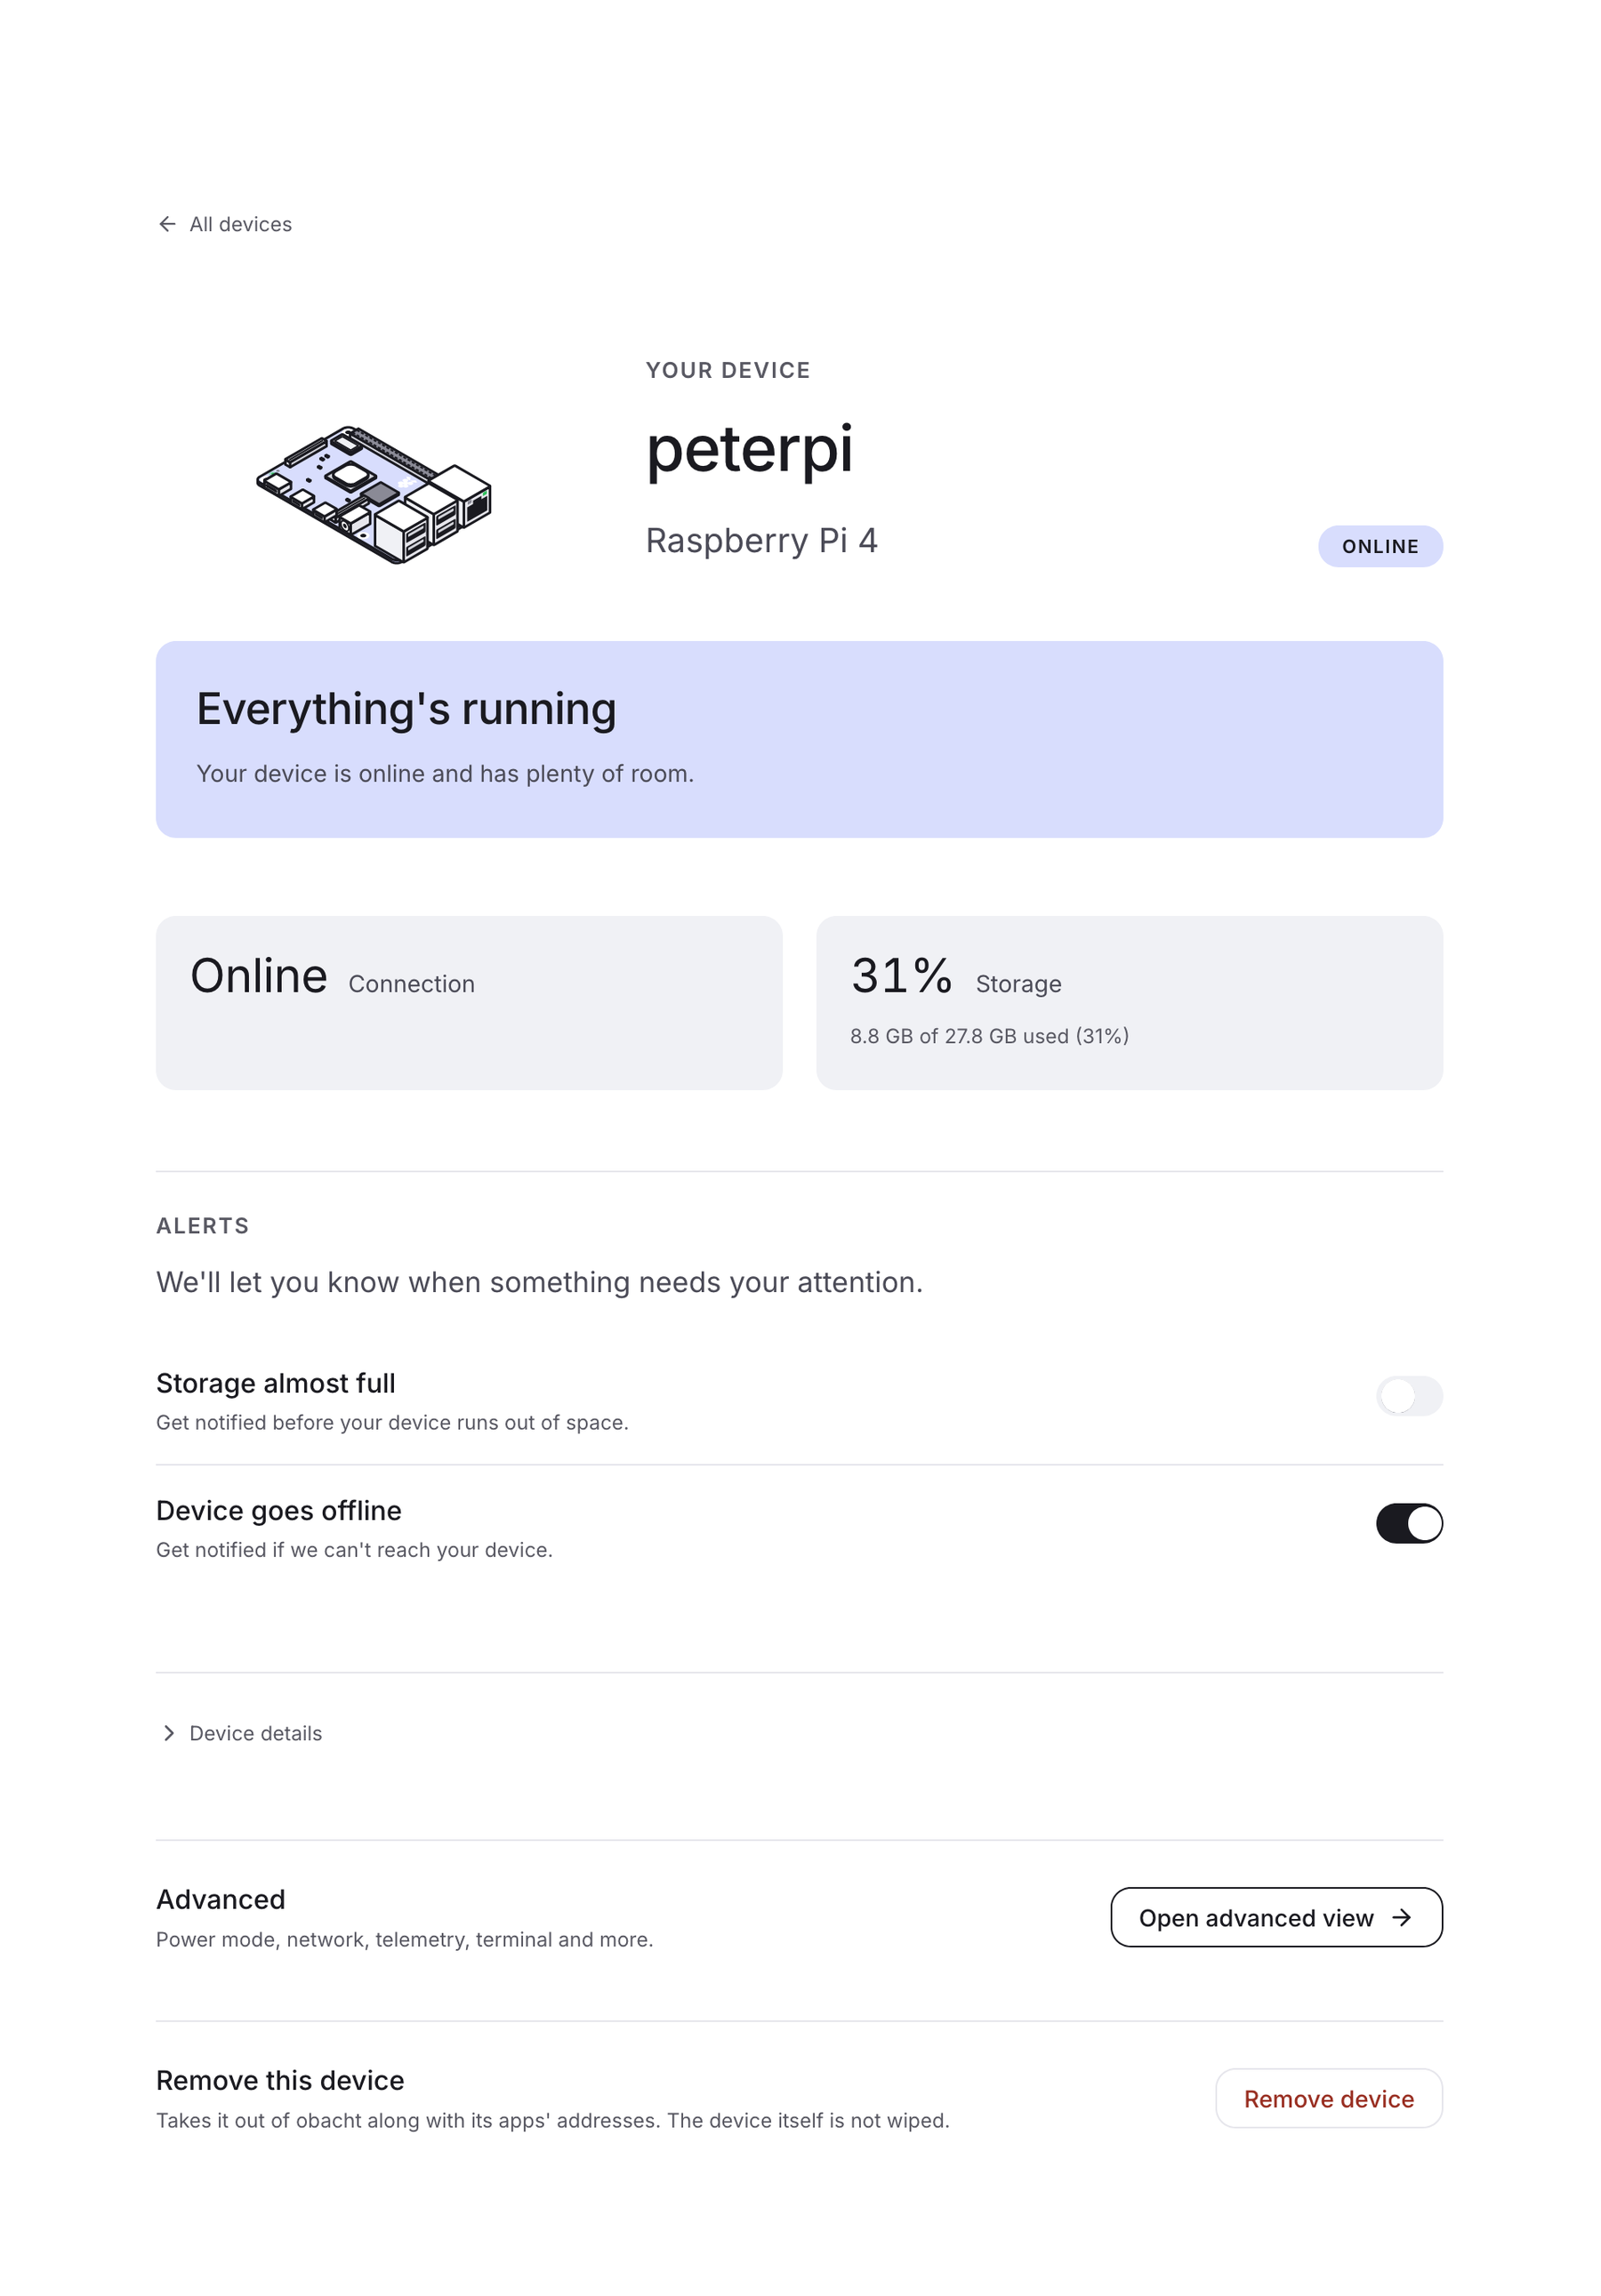
The page starts with a verdict card:
| Verdict | Meaning |
|---|---|
| Everything's running | The device is online and has enough free space. |
| Needs attention: device is offline | Obacht has not heard from the device. See Device shows offline. |
| Needs attention: storage almost full | The disk is running out. Remove an app or clear files. |
Below the verdict:
- Connection shows whether the device is online and connected to the Obacht network (the encrypted connection between your device and Obacht).
- Storage shows how full the disk is.
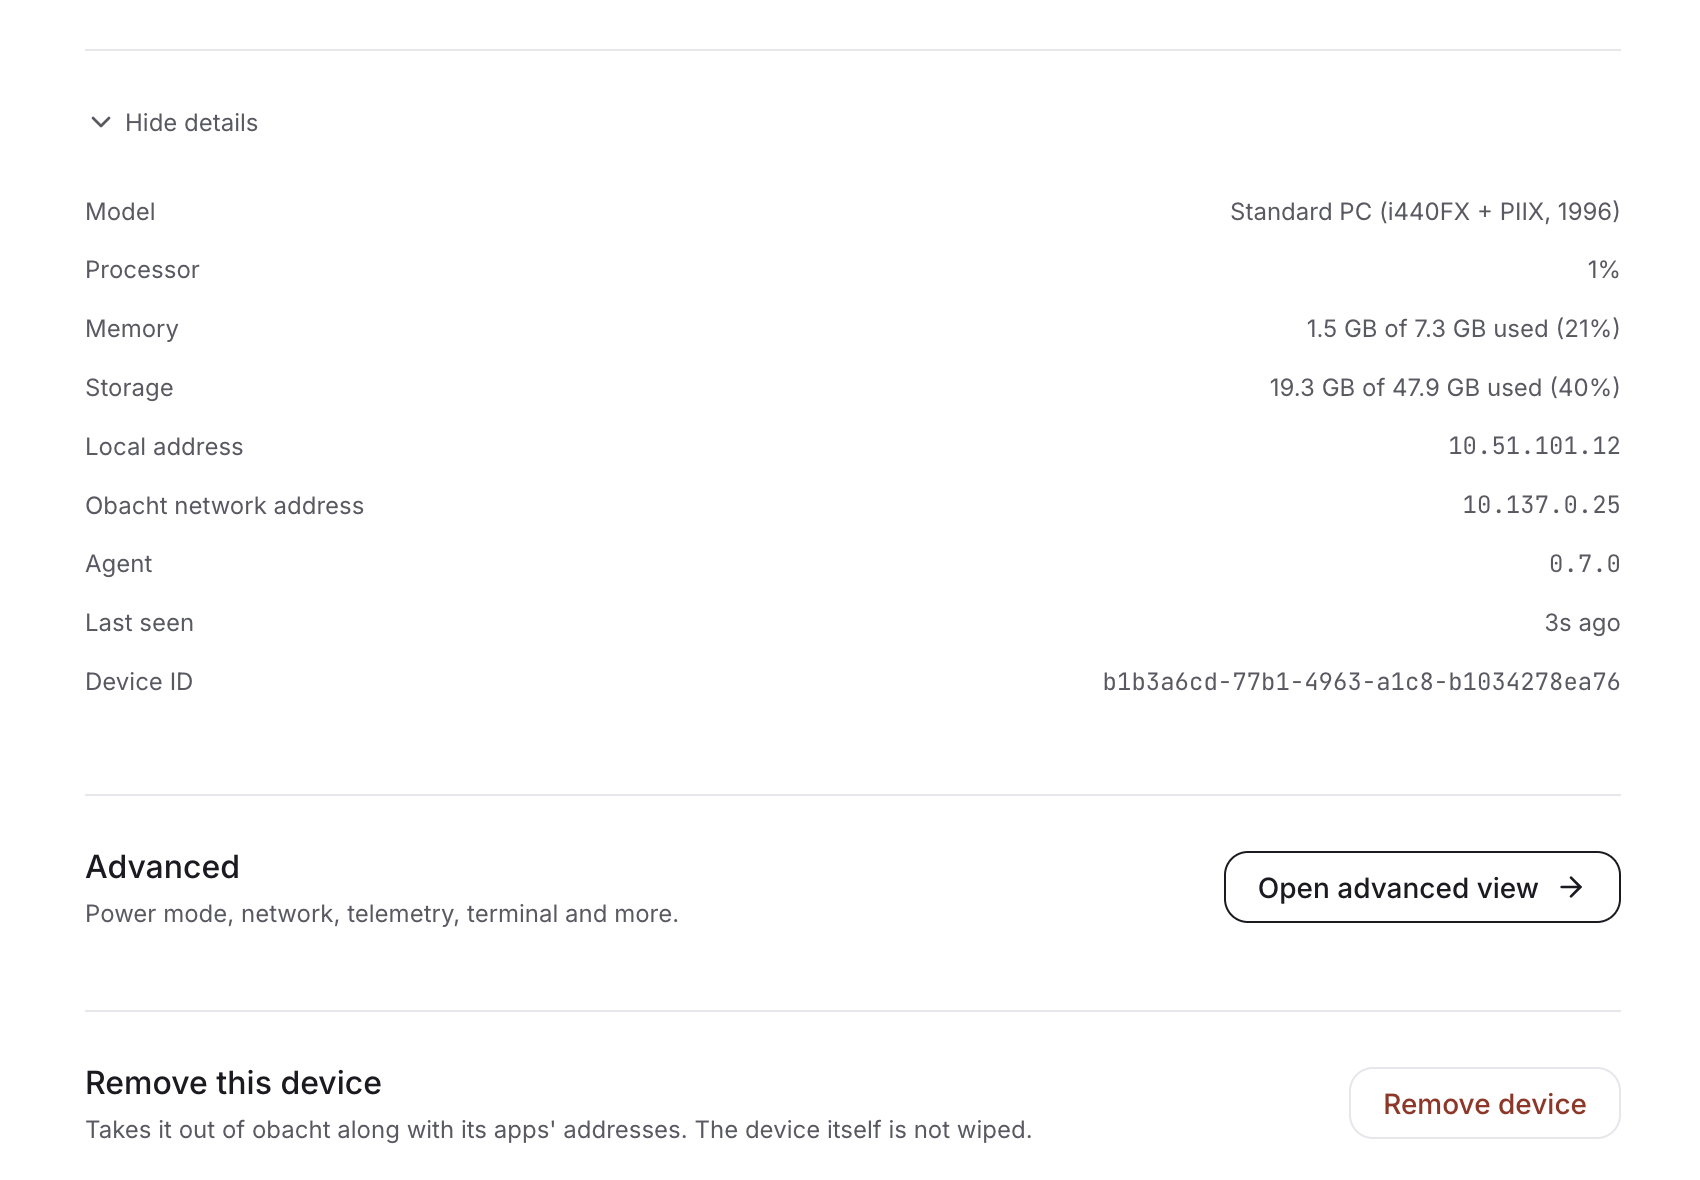
- Device details lists model, Pi generation, operating system, uptime, CPU, memory, temperature, local IP, Obacht network IP, agent version, last seen and the device ID. Support may ask you for the device ID.
- Apps on this device lists what is installed, with Add an app.
- Change picture lets you pick an illustration for the device or leave it on Automatic.
At the bottom you find Advanced: Open advanced view and Remove this device. Removing is covered in Update, restart, remove.
The two alert toggles
Right on the health page you find two switches:
- Storage almost full
- Device goes offline
Both are on for every new device. When one fires, you get an email. Turn a switch off if a device is meant to be off for a while, for example a Pi you only run on weekends.
Leave Device goes offline on for anything that hosts an app other people use. It is the quickest way to learn that a power cable came loose.
Monitoring tab (advanced view)
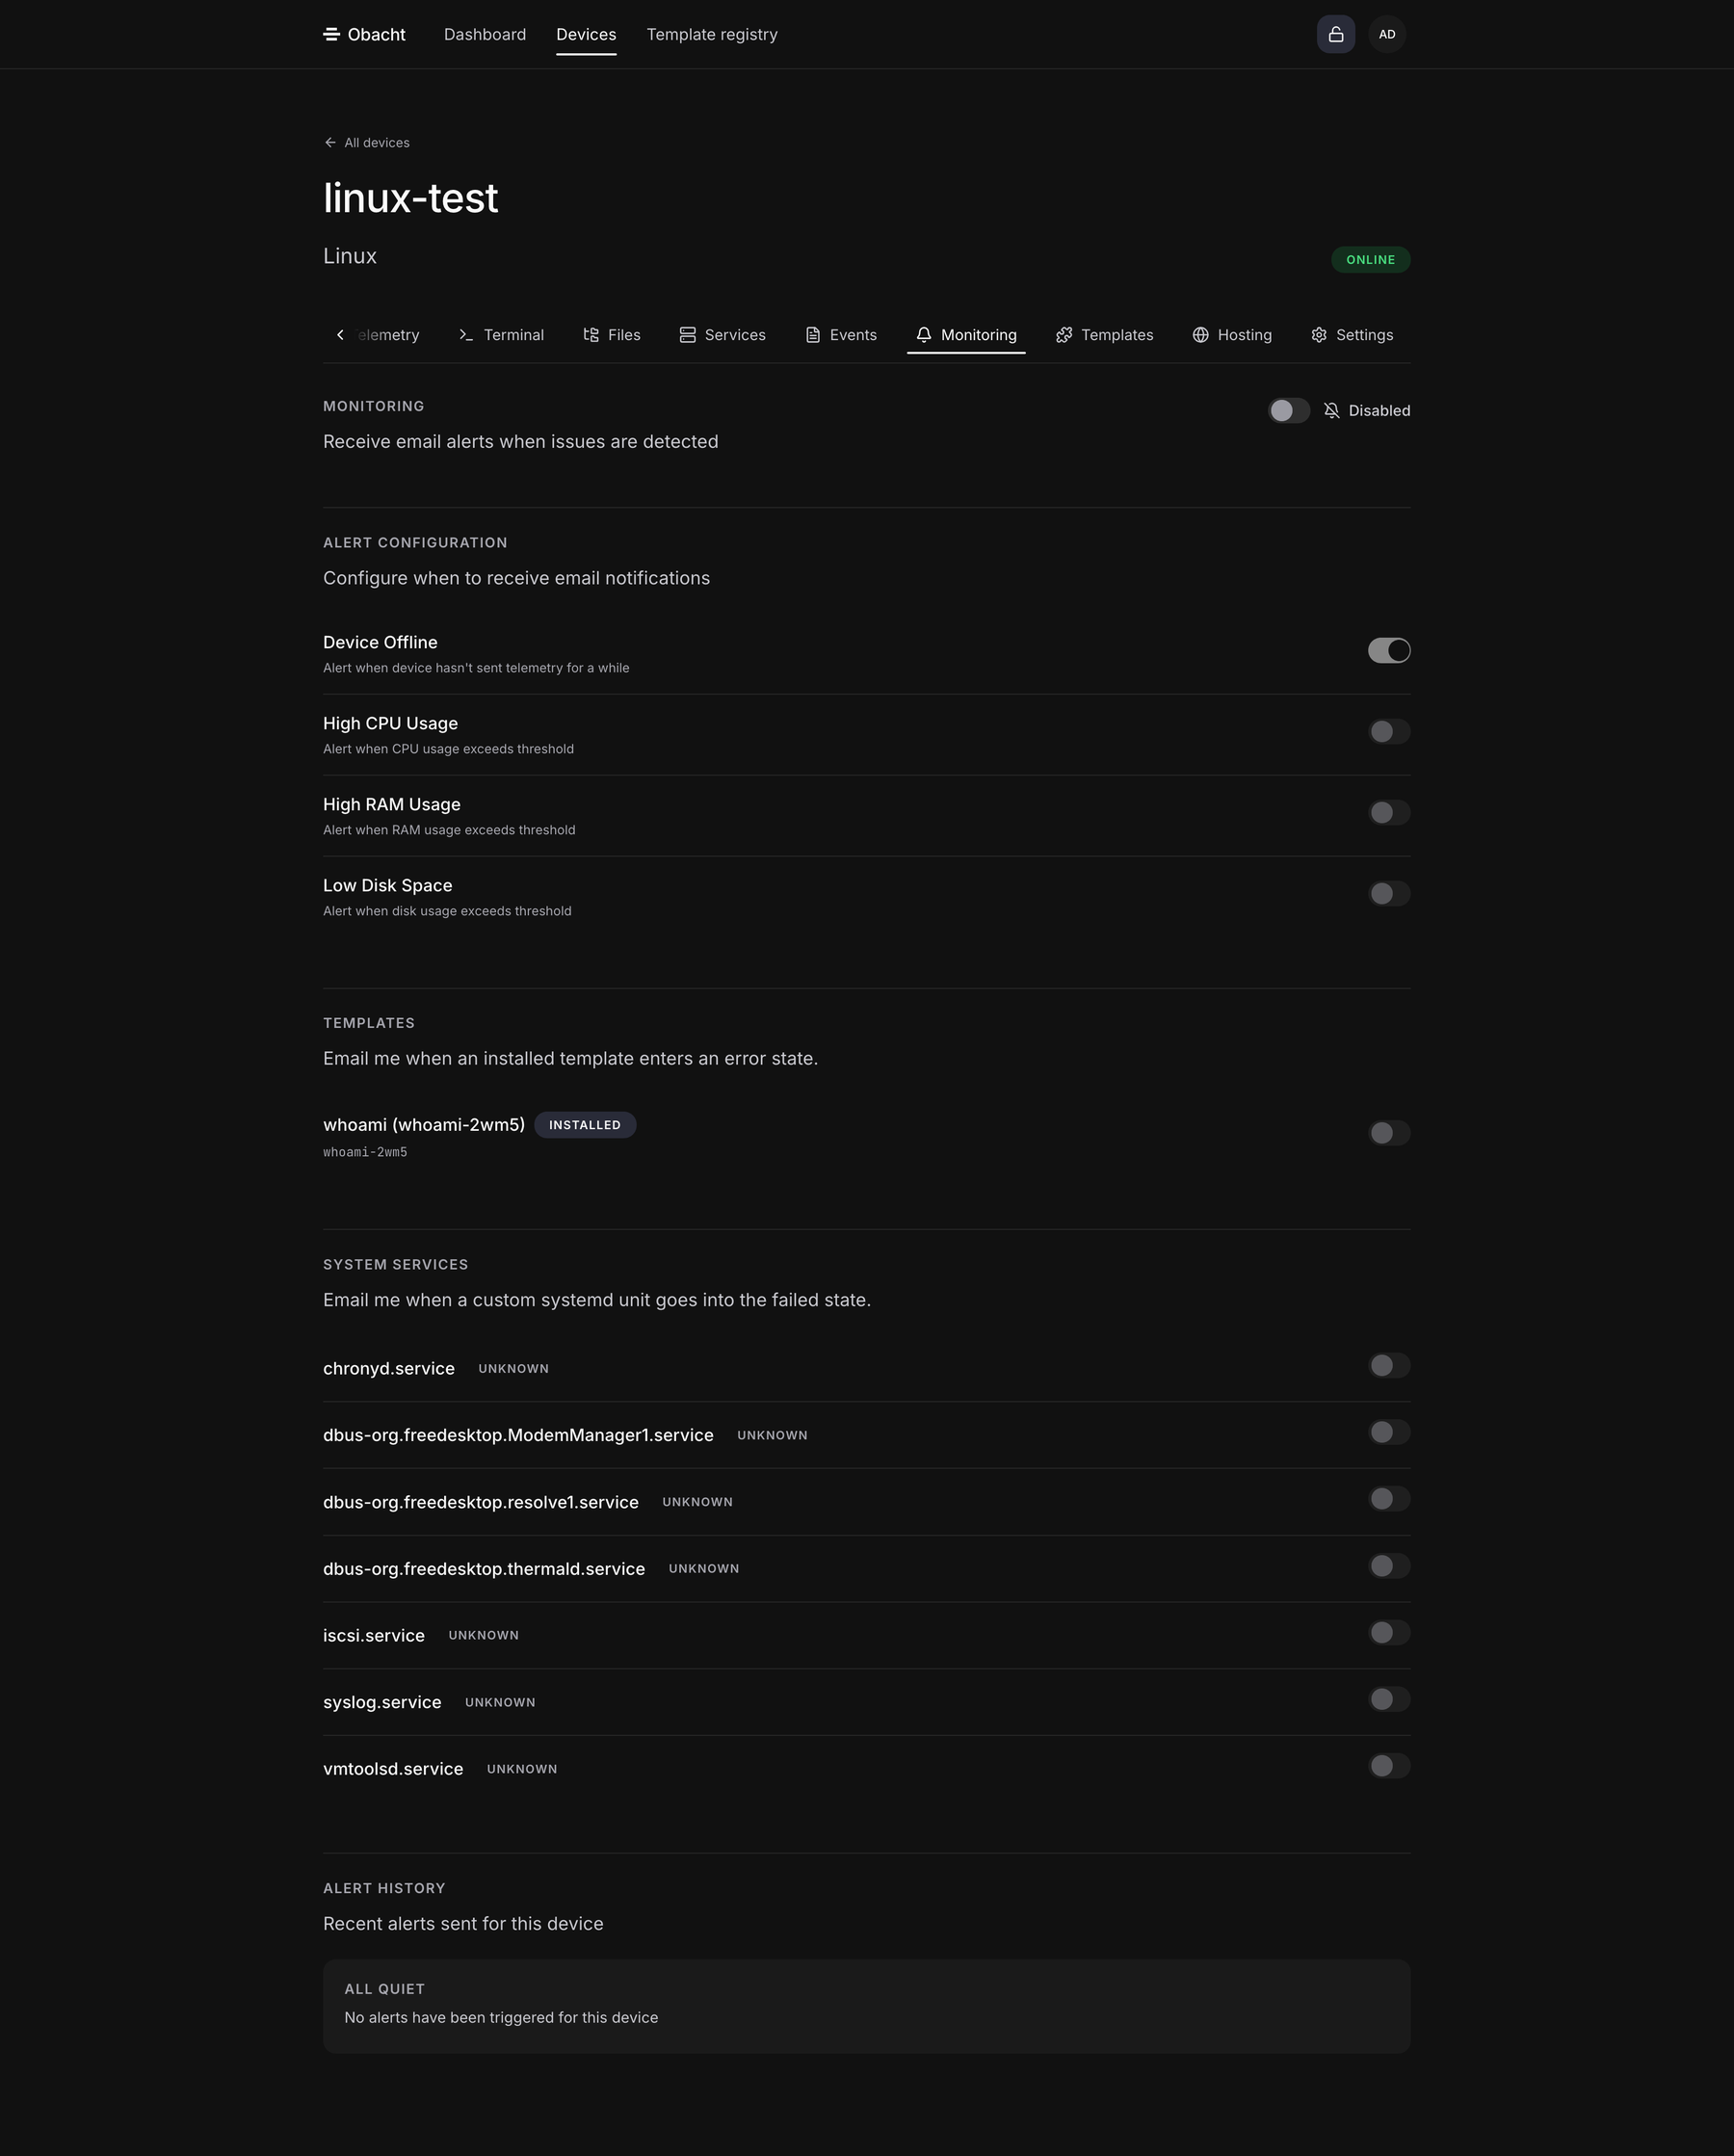
Open the advanced view and pick the Monitoring tab. Here you set the thresholds yourself:
| Alert | What you set |
|---|---|
| Device Offline | After how many minutes without contact the alert fires. |
| High CPU | A percentage. |
| High RAM | A percentage. |
| Low Disk | A percentage of free space. |
Below the thresholds you can switch monitoring on or off per app and, under System Services, per system service. Turn an app off here if it is expected to be stopped most of the time.
The alert history at the bottom lists what fired and when. The entries are of the types Device Offline, Low Disk Space, Service Failed and Template Error.
Events tab (advanced view)
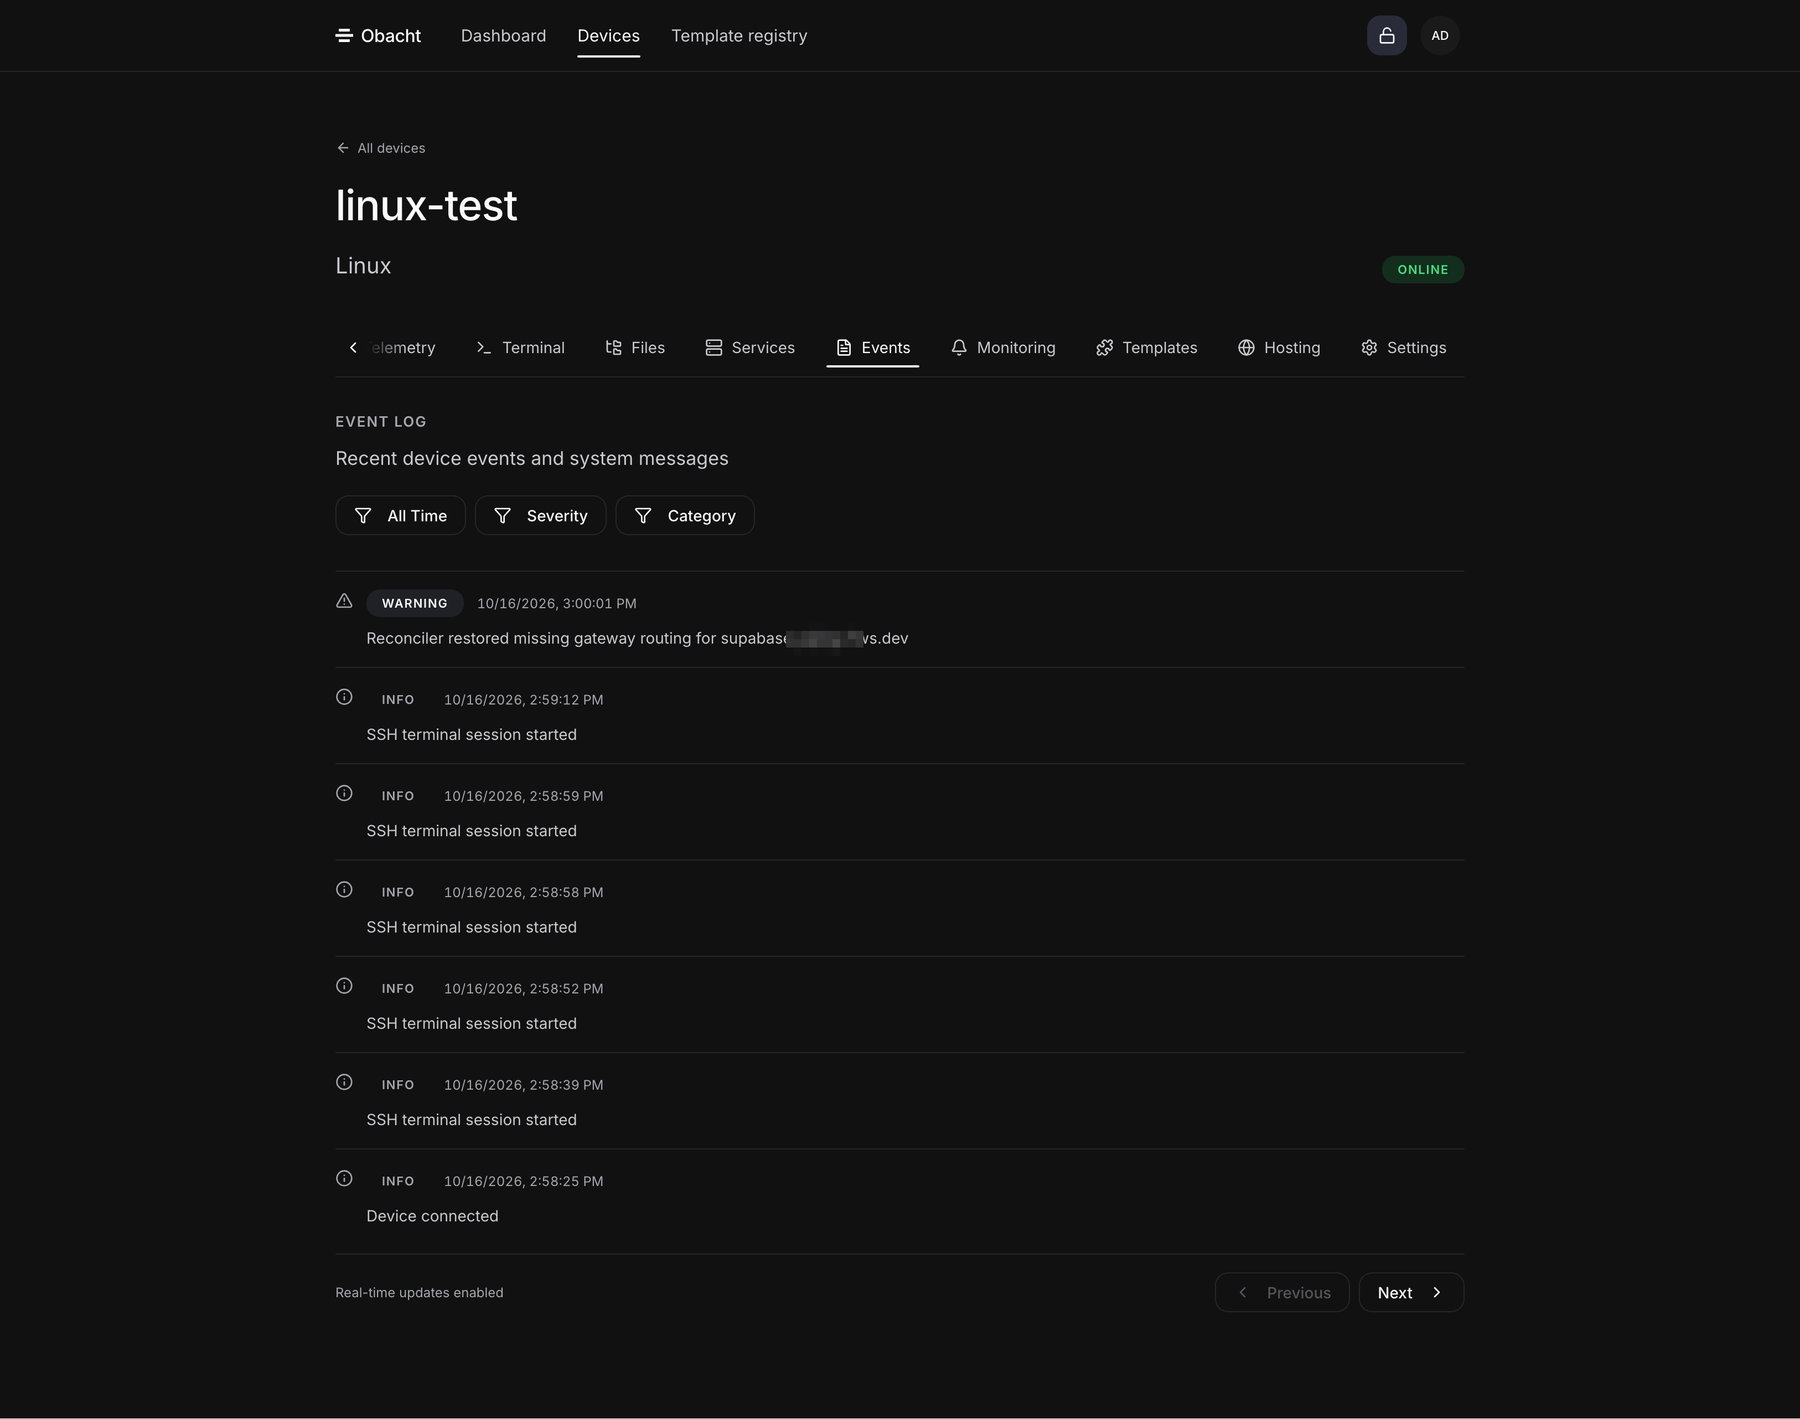
The Events tab is the device's log book: terminal sessions, installs, restarts, alerts. Filter by Time Period, Event Severity and Event Category, and page through older entries. While the tab is open it says Real-time updates enabled, so new events appear without reloading.
On a Mac the Monitoring and Events tabs work the same. Terminal, Files and Services are missing there, see Mac with the Obacht app.
Next: Terminal and files.